

6369
FIRES IN INDUSTRIAL AND MANUFACTURING PROPERTIES - PART 5
07/10/2018
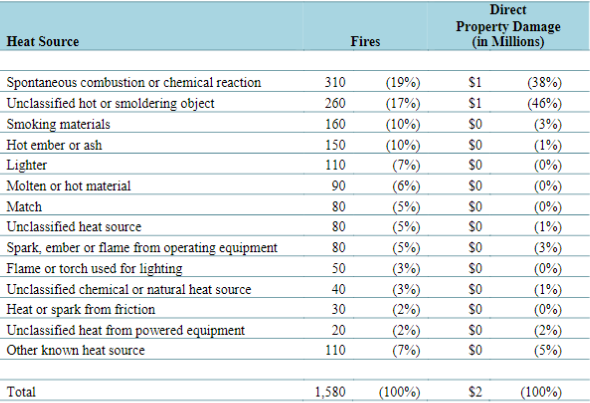
Table 51.
Outside Trash and Rubbish Fires in Industrial PropertiesBy Heat Source, 2011-2015 Annual Averages
Note: Sums may not equal totals due to rounding errors. Fires are rounded to the nearest ten, civilian deaths and injuries to the nearest one, and direct property damage is rounded to the nearest million dollars. Source: NFIRS 5.0 and NFPA Fire Experience Survey.
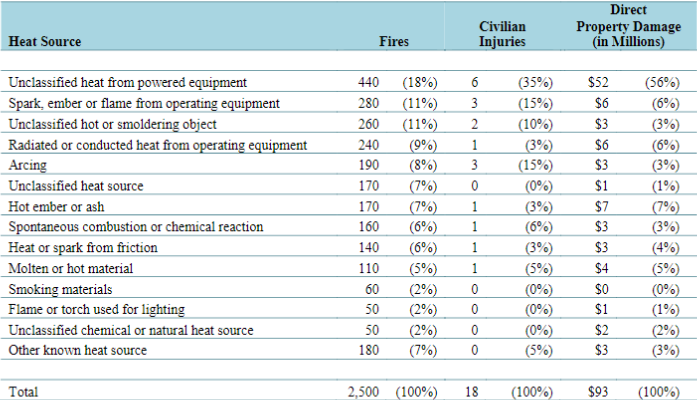
Table 51A.
Non-Trash Outside and Unclassified Fires in Industrial PropertiesBy Heat Source, 2011-2015 Annual Averages
Note: Sums may not equal totals due to rounding errors. Fires are rounded to the nearest ten, civilian deaths and injuries to the nearest one, and direct property damage is rounded to the nearest million dollars. Source: NFIRS 5.0 and NFPA Fire Experience Survey.
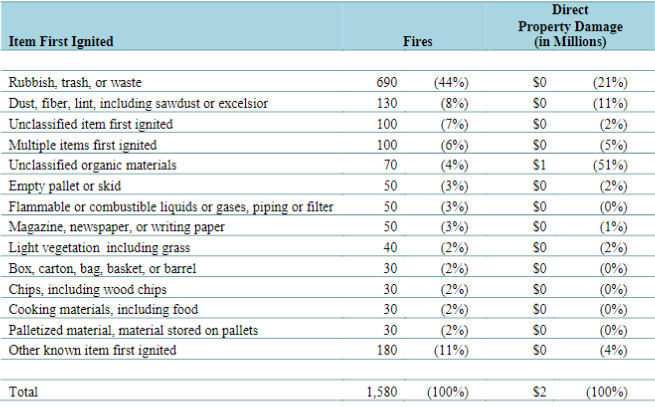
Table 52.
Outside Trash and Rubbish Fires in Industrial PropertiesBy Item First Ignited, 2011-2015 Annual Averages
Note: Sums may not equal totals due to rounding errors. Fires are rounded to the nearest ten, civilian deaths and injuries to the nearest one, and direct property damage is rounded to the nearest million dollars. Source: NFIRS 5.0 and NFPA Fire Experience Survey.
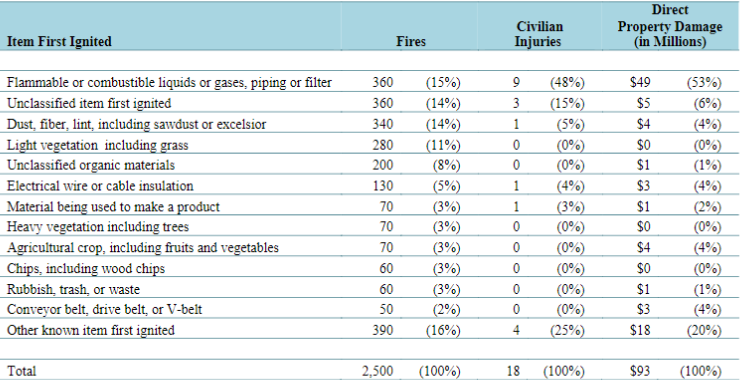
Table 52A.
Non-Trash Outside and Unclassified Fires in Industrial PropertiesBy Heat Source, 2011-2015 Annual Averages
Note: Sums may not equal totals due to rounding errors. Fires are rounded to the nearest ten, civilian deaths and injuries to the nearest one, and direct property damage is rounded to the nearest million dollars. Source: NFIRS 5.0 and NFPA Fire Experience Survey.
Table 53.
Outside Trash and Rubbish Fires in Manufacturing PropertiesBy Leading Cause, 2011-2015 Annual Averages
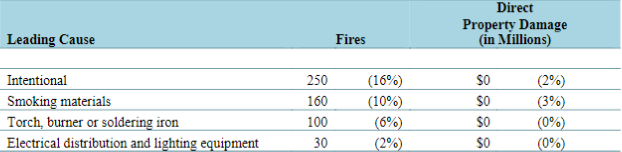
Note: Fires are rounded to the nearest ten, civilian deaths and injuries to the nearest one, and direct property damage is rounded to the nearest million dollars. Source: NFIRS 5.0 and NFPA Fire Experience Survey.
Table 53A.
Non-Trash Outside and Unclassified Fires in Manufacturing PropertiesBy Leading Cause, 2011-2015 Annual Averages
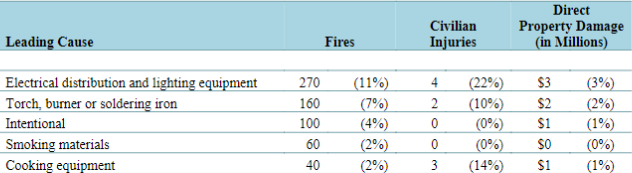
Note: Fires are rounded to the nearest ten, civilian deaths and injuries to the nearest one, and direct property damage is rounded to the nearest million dollars.
Source: NFIRS 5.0 and NFPA Fire Experience Survey
Table 54.
Outside Trash and Rubbish Fires in Manufacturing PropertiesBy Factor Contributing to Ignition, 2011-2015 Annual Averages
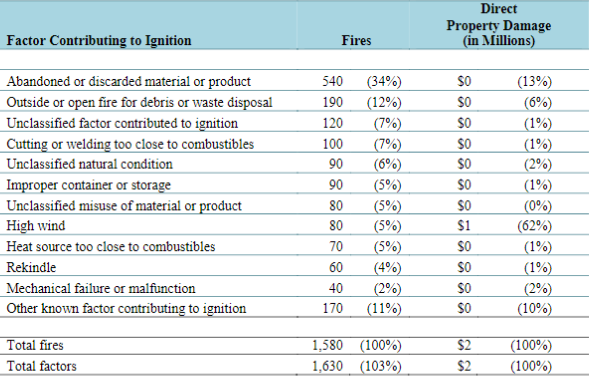
Note: Sums may not equal totals due to rounding errors. Fires are rounded to the nearest ten, civilian deaths and injuries to the nearest one, and direct property damage is rounded to the nearest million dollars.
Source: NFIRS 5.0 and NFPA Fire Experience Survey.
Table 54A.
Non-Trash Outside and Unclassified Fires in Manufacturing PropertiesBy Factor Contributing to Ignition, 2011-2015 Annual Averages
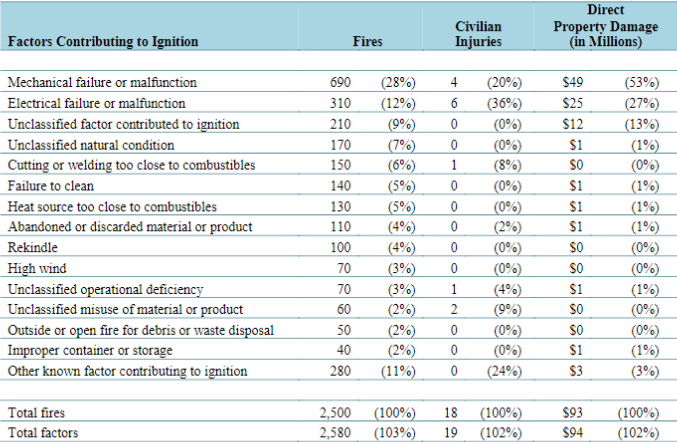
Note: Sums may not equal totals due to rounding errors. Fires are rounded to the nearest ten, civilian deaths and injuries to the nearest one, and direct property damage is rounded to the nearest million dollars. Source: NFIRS 5.0 and NFPA Fire Experience Survey.
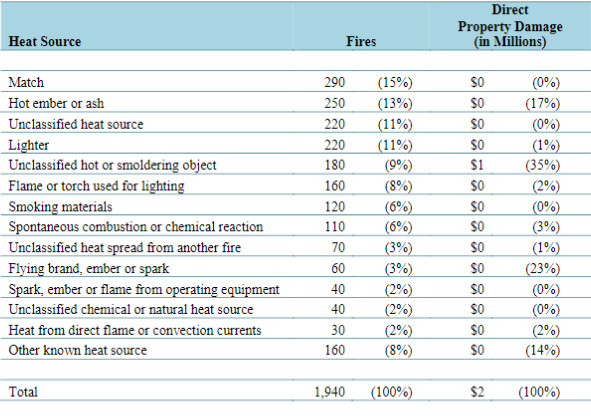
Table 55.
Outside Trash and Rubbish Fires in Manufacturing PropertiesBy Heat Source, 2011-2015 Annual Averages
Note: Sums may not equal totals due to rounding errors. Fires are rounded to the nearest ten, civilian deaths and injuries to the nearest one, and direct property damage is rounded to the nearest million dollars. Source: NFIRS 5.0 and NFPA Fire Experience Survey.
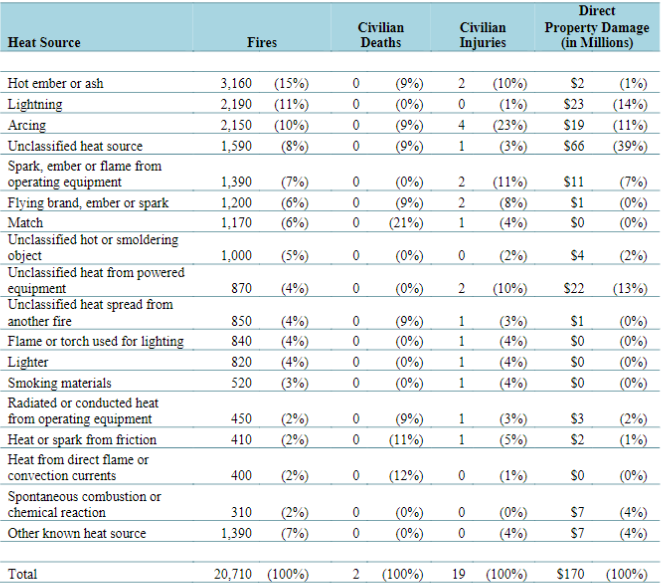
Table 55A.
Non-Trash Outside and Unclassified Fires in Manufacturing PropertiesBy Heat Source, 2011-2015 Annual Averages
Note: Sums may not equal totals due to rounding errors. Fires are rounded to the nearest ten, civilian deaths and injuries to the nearest one, and direct property damage is rounded to the nearest million dollars. Source: NFIRS 5.0 and NFPA Fire Experience Survey.
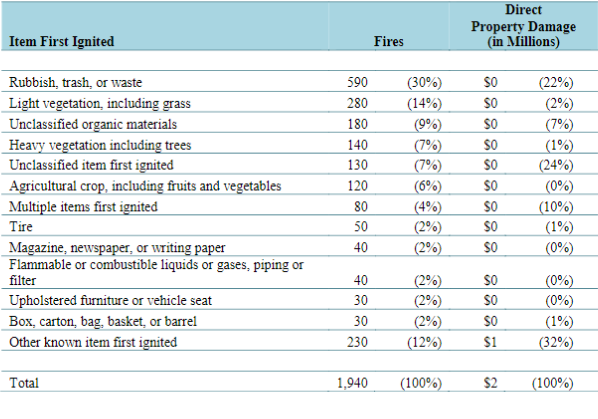
Table 56.
Outside Trash and Rubbish Fires in Manufacturing PropertiesBy Item First Ignited, 2011-2015 Annual Averages
Note: Sums may not equal totals due to rounding errors. Fires are rounded to the nearest ten, civilian deaths and injuries to the nearest one, and direct property damage is rounded to the nearest million dollars. Source: NFIRS 5.0 and NFPA Fire Experience Survey.
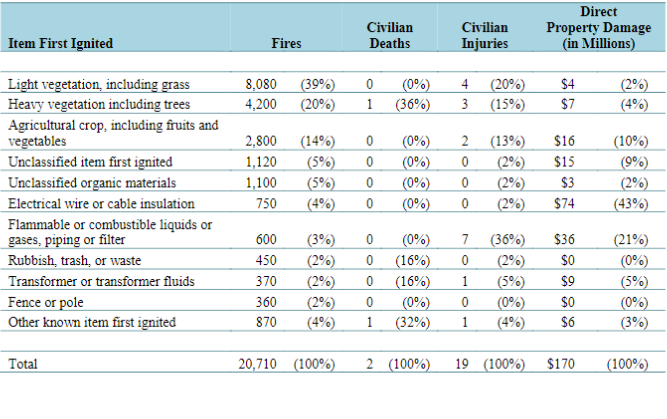
Table 56A.
Non-Trash Outside and Unclassified Fires in Manufacturing PropertiesBy Item First Ignited, 2011-2015 Annual Averages
Note: Sums may not equal totals due to rounding errors. Fires are rounded to the nearest ten, civilian deaths and injuries to the nearest one, and direct property damage is rounded to the nearest million dollars. Source: NFIRS 5.0 and NFPA Fire Experience Survey.
Appendix A.
How National Estimates Statistics Are Calculated
The statistics in this analysis are estimates derived from the U.S. Fire Administration’s (USFA’s) National Fire Incident Reporting System (NFIRS) and the National Fire Protection Association’s (NFPA’s) annual survey of U.S. fire departments. NFIRS is a voluntary system through which participating fire departments report detailed factors about the fires to which they respond. Roughly two-thirds of U.S. fire departments participate, although not all of these departments provide data every year. Fires reported to federal or state fire departments or industrial fire brigades are not included in these estimates.NFIRS provides the most detailed incident information of any national database not limited to large fires. NFIRS is the only database capable of addressing national patterns for fires of all sizes by specific property use and specific fire cause. NFIRS also captures information on the extent of flame spread, and automatic detection and suppression equipment. For more information about NFIRS visit https://www.usfa.fema.gov/data/nfirs/. NFIRS has a wide variety of data elements and codes. Many code choices describe several conditions. These cannot be broken down further. For example, area of origin code 83 captures fires starting in vehicle engine areas, running gear areas or wheel areas. It is not possible to tell the portion of each from the coded data.Methodology may change slightly from year to year. NFPA is continually examining its methodology to provide the best possible answers to specific questions. From time to time, changes are made to methodologies or groupings. Earlier editions of the same report may have used different methodologies to produce the same analysis, meaning that the estimates are not directly comparable from year to year. Readers should use the latest report available and contact us if clarification is needed. NFPA’s fire department experience survey provides estimates of the big picture. Each year, NFPA conducts an annual survey of fire departments which enables us to capture a summary of fire department experience on a larger scale. Surveys are sent to all municipal departments protecting populations of 5,000 or more and a random sample, stratified by community size, of the smaller departments. Typically, a total of roughly 3,000 surveys are returned, representing about one of every ten U.S. municipal fire departments serving about one third of the U.S. population. The survey is stratified by size of population protected to reduce the uncertainty of the final estimate. Small rural communities have fewer people protected per department and are less likely to respond to the survey. A larger number must be surveyed to obtain an adequate sample of those departments. (NFPA also makes follow-up calls to a sample of the smaller fire departments that do not respond, to confirm that those that did respond are truly representative of fire departments their size.) On the other hand, large city departments are so few in number and protect such a large proportion of the total U.S. population that it makes sense to survey all of them. Most respond, resulting in excellent precision for their part of the final estimate. The survey includes the following information: (1) the total number of fire incidents, civilian deaths, and civilian injuries, and the total estimated property damage (in dollars), for each of the major property use classes defined in NFIRS; (2) the number of on-duty firefighter injuries, by type of duty and nature of illness; 3) the number and nature of non-fire incidents; and (4) information on the type of community protected (e.g., county versus township versus city) and the size of the population protected, which is used in the statistical formula for projecting national totals from sample results. The results of the survey are published in the annual report Fire Loss in the United States.
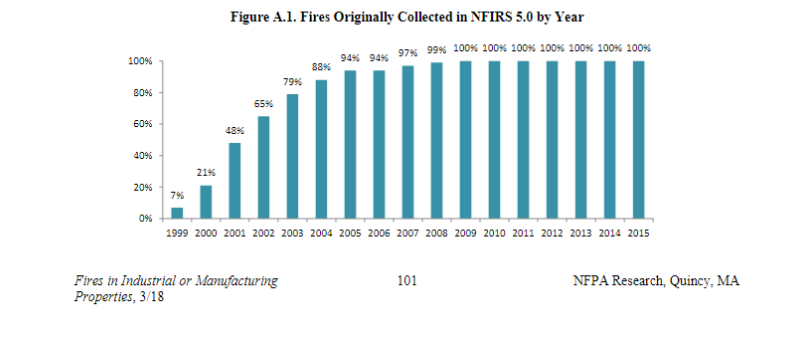
PROJECTING NFIRS TO NATIONAL ESTIMATESAs noted, NFIRS is a voluntary reporting system. Different states and jurisdictions have different reporting requirements and practices. Participation rates in NFIRS are not necessarily uniform across regions and community sizes, both factors correlated with frequency and severity of fires. This means NFIRS may be susceptible to systematic biases. No one at present can quantify the size of these deviations from the ideal, representative sample. But there is enough reason for concern so that a second database -- the NFPA’s fire experience survey -- is needed to project NFIRS to national estimates and to project different parts of NFIRS separately. This multiple calibration approach makes use of the annual NFPA’s fire experience survey where its statistical design advantages are strongest.Scaling ratios are obtained by comparing NFPA’s projected totals of residential structure fires, non-residential structure fires, vehicle fires, and outside and other fires, and associated civilian deaths, civilian injuries, and direct property damage with comparable totals in NFIRS. Estimates of specific fire problems and circumstances are obtained by multiplying the NFIRS data by the scaling ratios. Reports for incidents in which mutual aid was given are excluded from NFPA’s analyses.Analysts at the NFPA, the USFA and the Consumer Product Safety Commission developed the analytical rules used in analyzing data from the two data sets. "The National Estimates Approach to U.S. Fire Statistics," by John R. Hall, Jr. and Beatrice Harwood, provides a more detailed explanation of national estimates. Version 5.0 of NFIRS, first introduced in 1999, used a different coding structure for many data elements, added some property use codes, and dropped others. The essentials of the approach described by Hall and Harwood are still used, but some modifications have been necessary to accommodate the changes in NFIRS 5.0. For 2002 data on, analyses are based on scaling ratios using only data originally collected in NFIRS 5.0: NFPA’s fire experience survey projectionsNFIRS totals (Version 5.0)For 1999 to 2001, the same rules may be applied, but estimates for these years in this form will be less reliable due to the smaller amount of data originally collected in NFIRS 5.0; they should be viewed with extreme caution.
NFIRS 5.0 introduced six categories of confined structure fires, including:•cooking fires confined to the cooking vessel, •confined chimney or flue fires, •confined incinerator fire, •confined fuel burner or boiler fire or delayed ignition, •confined commercial compactor fire, and•trash or rubbish fires in a structure with no flame damage to the structure or its contents.Although causal and other detailed information is typically not required for these incidents, it is provided in some cases. Some analyses, particularly those that examine cooking equipment, heating equipment, fires caused by smoking materials, and fires started by playing with fire, may examine the confined fires in greater detail. Because the confined fire incident types describe certain scenarios, the distribution of unknown data differs from that of all fires. Consequently, allocation of unknowns must be done separately. Some analyses of structure fires show only non-confined fires. In these tables, percentages shown are of non-confined structure fires rather than all structure fires. This approach has the advantage of showing the frequency of specific factors in fire causes, but the disadvantage of possibly overstating the percentage of factors that are seldom seen in the confined fire incident types and of understating the factors specifically associated with the confined fire incident types. Other analyses include entries for confined fire incident types in the causal tables and show percentages based on total structure fires. In these cases, the confined fire incident type is treated as a general causal factor. For most fields other than Property Use and Incident Type, NFPA allocates unknown data proportionally among known data. This approach assumes that if the missing data were known, it would be distributed in the same manner as the known data. NFPA makes additional adjustments to several fields. Casualty and loss projections can be heavily influenced by the inclusion or exclusion of unusually serious fire. SPECIFIC DATA ELEMENTSIn the formulas that follow, the term “all fires” refers to all fires in NFIRS on the dimension studied. The percentages of fires with known or unknown data are provided for non-confined fires and associated losses, and for confined fires only.Cause of Ignition: This field is used chiefly to identify intentional fires. “Unintentional” in this field is a specific entry and does not include other fires that were not intentionally set: failure of equipment or heat source, act of nature, or “other” (unclassified).” The last should be used for exposures but has been used for other situations as well. Fires that were coded as under investigation and those that were coded as undetermined after investigation were treated as unknown. Factor Contributing to Ignition: In this field, the code “none” is treated as an unknown and allocated proportionally. For Human Factor Contributing to Ignition, NFPA enters a code for “not reported” when no factors are recorded. “Not reported” is treated as an unknown, but the code “none” is treated as a known code and not allocated. Multiple entries are allowed in both of these fields. Percentages are calculated on the total number of fires, not entries, resulting in sums greater than 100%. Although Factor Contributing to Ignition is only required when the cause of ignition was coded as: 2) unintentional, 3) failure of equipment or heat source; or 4) act of nature, data is often present when not required. Consequently, any fire in which no factor contributing to ignition was entered was treated as unknown.
In some analyses, all entries in the category of mechanical failure, malfunction (factor contributing to ignition 20-29) are combined and shown as one entry, “mechanical failure or malfunction.” This category includes:21. Automatic control failure;22. Manual control failure;23. Leak or break. Includes leaks or breaks from containers or pipes. Excludes operational deficiencies and spill mishaps;25. Worn out;26. Backfire. Excludes fires originating as a result of hot catalytic converters; 27. Improper fuel used; Includes the use of gasoline in a kerosene heater and the like; and 20. Mechanical failure or malfunction, other.Entries in “electrical failure, malfunction” (factor contributing to ignition 30-39) may also be combined into one entry, “electrical failure or malfunction.” This category includes:31. Water-caused short circuit arc;32. Short-circuit arc from mechanical damage;33. Short-circuit arc from defective or worn insulation;34. Unspecified short circuit arc;35. Arc from faulty contact or broken connector, including broken power lines and loose connections; 36. Arc or spark from operating equipment, switch, or electric fence; 37. Fluorescent light ballast; and 30. Electrical failure or malfunction, other.Heat Source. In NFIRS 5.0, one grouping of codes encompasses various types of open flames and smoking materials. In the past, these had been two separate groupings. A new code was added to NFIRS 5.0, which is code 60: “Heat from open flame or smoking material, other.” NFPA treats this code as a partial unknown and allocates it proportionally across the codes in the 61-69 range, shown below.61. Cigarette;62. Pipe or cigar;63. Heat from undetermined smoking material;64. Match;65. Lighter: cigarette lighter, cigar lighter;66. Candle;67 Warning or road flare, fuse;68. Backfire from internal combustion engine. Excludes flames and sparks from an exhaust system, (11); and 69. Flame/torch used for lighting. Includes gas light and gas-/liquid-fueled lantern.In addition to the conventional allocation of missing and undetermined fires, NFPA multiplies fires with codes in the 61-69 range byAll fires in range 60-69All fires in range 61-69The downside of this approach is that heat sources that are truly a different type of open flame or smoking material are erroneously assigned to other categories. The grouping “smoking materials” includes codes 61-63 (cigarettes, pipes or cigars, and heat from undetermined smoking material, with a proportional share of the code 60s and true unknown data.
Equipment Involved in Ignition (EII). NFIRS 5.0 originally defined EII as the piece of equipment that provided the principal heat source to cause ignition if the equipment malfunctioned or was used improperly. In 2006, the definition was modified to “the piece of equipment that provided the principal heat source to cause ignition.” However, much of the data predates the change. Individuals who have already been trained with the older definition may not change their practices. To compensate, NFPA treats fires in which EII = NNN and heat source is not in the range of 40-99as an additional unknown. To allocate unknown data for EII, the known data is multiplied byAll fires(All fires – blank – undetermined – [fires in which EII =NNN and heat source <>40-99])In addition, the partially unclassified codes for broad equipment groupings (i.e., code 100 - heating, ventilation, and air conditioning, other; code 200 - electrical distribution, lighting and power transfer, other; etc.) were allocated proportionally across the individual code choices in their respective broad groupings (heating, ventilation, and air conditioning; electrical distribution, lighting and power transfer, other; etc.). Equipment that is totally unclassified is not allocated further. This approach has the same downside as the allocation of heat source 60 described above. Equipment that is truly different is erroneously assigned to other categories.
| Code Grouping | EII Code | NFIRS definitions |
| Central heat | 132 | Furnace or central heating unit |
| 133 |
Boiler (power, process or heating)
|
|
| Fixed or portable space heater | 131 |
Furnace, local heating unit, built-in
|
| 123 | Fireplace with insert or stove | |
| 124 | Heating stove | |
| 141 |
Heater, excluding catalytic and oil-filled
|
|
| 142 | Catalytic heate | |
| 143 |
Oil filled heater
|
|
|
Fireplace or chimney
|
120 | Fireplace or chimney |
| 121 | Fireplace, masonry | |
| 122 |
Fireplace, factory-built
|
|
| 125 | Chimney connector or vent connector | |
| 126 |
Chimney-brick, stone or masonry
|
|
| 127 |
Chimney-metal, including stovepipe or flue
|
|
|
Fixed wiring and related equipment
|
210 | Unclassified electrical wiring |
| 211 | Electrical power or utility line | |
| 212 | Electrical service supply wires from utility | |
| 213 | Electric meter or meter box | |
| 214 | Wiring from meter box to circuit breake | |
| 215 |
Panel board, switch board or
circuit breaker
board
|
|
| 216 | Electrical branch circuit | |
| 217 | Outlet or receptacle | |
| 218 | Wall switch | |
| 219 | Ground fault interrupter | |
| Transformers and power supplies | 221 |
Distribution-type transformer
|
| 222 | Overcurrent, disconnect equipment | |
| 223 |
Low-voltage transformer
|
|
| 224 | Generator | |
| 225 | Inverter | |
| 226 | Uninterrupted power supply (UPS | |
| 227 | Surge protector | |
| 228 | Battery charger or rectifie | |
| 229 | Battery (all types) |
| Code Grouping | EII Code | NFIRS definitions |
|
NFIRS definitions Lamp, bulb or lighting
|
230 | Unclassified lamp or lighting |
| 231 |
Lamp
-
tabletop, floor or desk
|
|
| 232 | Lantern or flashlight | |
| 233 | Incandescent lighting fixture | |
| 234 | Fluorescent light fixture or ballast | |
| 235 | Halogen light fixture or lamp | |
| 236 |
Sodium or mercury vapor light fixture or lamp
|
|
| 237 | Work or trouble light | |
| 238 | Light bulb | |
| 241 | Nightlight | |
| 242 |
Decorative lights - line voltage
|
|
| 243 |
Decorative or landscape lighting–low voltage
|
|
| Cord or plug | 244 |
Sign
|
| 260 | Unclassified cord or plug | |
| 261 |
Power cord or plug, detachable from appliance
|
|
| 262 |
Power cord or plug-permanently attache
|
|
| 263 | Extension cord | |
| Torch, burner or soldering iron | 331 | Welding torch |
| 332 | Cutting torch | |
| 333 | Burner, including Bunsen burner | |
| 334 | Soldering equipment | |
|
Portable cooking or warming equipment
|
631 | Coffee maker or teapot |
| 632 |
Food warmer or hot plate
|
|
| 633 | Kettle | |
| 634 | Popcorn popper | |
| 635 | Pressure cooker or canne | |
| 636 | Slow cooker | |
| 637 | Toaster, toaster oven, counter top boiler | |
| 638 | Waffle iron, griddle | |
| 639 |
Wok, frying pan, skillet
|
|
| 640 | Breadmaking machine |
Area of Origin. Two areas of origin: bedroom for more than five people (code 21) and bedroom for less than five people (code 22) are combined and shown as simply “bedroom.” Chimney is no longer a valid area of origin code for non-confined fires.Item First Ignited. In most analyses, mattress and pillows (item first ignited 31) and bedding, blankets, sheets, and comforters (item first ignited 32) are combined and shown as “mattresses and bedding.” In many analyses, wearing apparel not on a person (code 34) and wearing apparel on a person (code 35) are combined and shown as “clothing.” In some analyses, flammable and combustible liquids and gases, piping and filters (item first ignited 60-69) are combined and shown together. Extent of Fire Spread. All structure fires with incident types indicating a confined fire were shown separately and are assumed to be confined to the object of origin. Fires that spread beyond the room of origin are calculated by summing fires with damage: a) confined to the floor of origin (code 3), b) confined to the building of origin (code 4), and c) extending beyond building of origin (code 5).Rounding and percentages. The data shown are estimates and generally rounded. An entry of zero may be a true zero or it may mean that the value rounds to zero. Percentages are calculated from unrounded values. It is quite possible to have a percentage entry of up to 100% even if the rounded number entry is zero. The same rounded value may account for a slightly different percentage share. Because percentages are expressed in integers and not carried out to several decimal places, percentages that appear identical may be associated with slightly different values. Inflation. Property damage estimates are not adjusted for inflation unless so indicated.
Appendix B.
Methodology and Definitions Used in “Leading Cause” Tables
The cause table reflects relevant causal factors that accounted for at least 2% of the fires in a given occupancy. Only those causes that seemed to describe a scenario are included. Because the causal factors are taken from different fields, some double counting is possible. Percentages are calculated against the total number of structure fires, including both confined and non-confined fires. Bear in mind that every fire has at least three “causes” in the sense that it could have been prevented by changing behavior, heat source, or ignitability of first fuel, the last an aspect not reflected in any of the major cause categories. For example, several of the cause categories in this system refer to types of equipment (cooking, heating, electrical distribution and lighting, clothes dryers and washers, torches). However, the problem may be not with the equipment but with the way it is used. The details in national estimates are derived from the U.S. Fire Administration’s National Fire Incident Reporting System (NFIRS). This methodology is based on the coding system used in Version 5.0 of NFIRS. The NFIRS 5.0 Reference Guide, containing all of the codes, can be downloaded from http://www.nfirs.fema.gov/documentation/reference/. Cooking equipment and heating equipment are calculated by summing fires identified by equipment involved in ignition and relevant confined fires. Confined fires will be shown if they account for at least 2% of the incidents. Confined cooking fires (cooking fires involving the contents of a cooking vessel without fire extension beyond the vessel) are identified by NFIRS incident type 113.Confined heating equipment fires include confined chimney or flue fires (incident type 114) and confined fuel burner or boiler fires (incident type 116). The latter includes delayed ignitions and incidents where flames caused no damage outside the fire box. The two types of confined heating fires may be combined or listed separately, depending on the numbers involved. Intentional fires are identified by fires with a “1” (intentional) in the field “cause.” The estimate includes a proportional share of fires in which the cause was undetermined after investigation, under investigation, or not reported. All fires with intentional causes are included in this category regardless of the age of the person involved. Earlier versions of NFIRS included codes for incendiary and suspicious. Intentional fires were deliberately set; they may or may not be incendiary in a legal sense. No age restriction is applied. Fires caused by playing with heat source (typically matches or lighters) are identified by code 19 in the field “factor contributing to ignition.” Fires in which the factor contribution to ignition was undetermined (UU), entered as none (NN) or left blank are considered unknown and allocated proportionally. Because factor contributing to ignition is not required for intentional fires, the share unknown, by these definitions, is somewhat larger than it should be. The heat source field is used to identify fires started by: smoking materials (cigarette, code 61; pipe or cigar, code 62; and heat from undetermined smoking material, code 63); candles (code 66), lightning (code 73); and spontaneous combustion or chemical reaction (code 72). Fires started by heat from unclassified open flame or smoking materials (code 60) are allocated proportionally among the “other open flame or smoking material” codes (codes 61-69) in an allocation of partial unknown data. This includes smoking materials and candles. This approach results in any true unclassified smoking or open flame heat sources such as incense being inappropriately allocated. However, in many fires, this code was used as an unknown. The equipment involved in ignition field is used to find several cause categories. This category includes equipment that functioned properly and equipment that malfunctioned.
Cooking equipmentNon-confined fire refers to equipment used to cook, heat or warm food (codes 620-649 and 654). Fire in which ranges, ovens or microwave ovens, food warming appliances, fixed or portable cooking appliances, deep fat fryers, open fired charcoal or gas grills, grease hoods or ducts, or other cooking appliances) were involved in the ignition are said to be caused by cooking equipment. Food preparation devices that do not involve heating, such as can openers or food processors, are not included here. As noted in Appendix A, a proportional share of unclassified kitchen and cooking equipment (code 600) is included here.Heating equipment Non-confined fire (codes 120-199) includes central heat, portable and fixed heaters (including wood stoves), fireplaces, chimneys, hot water heaters, and heat transfer equipment such as hot air ducts or hot water pipes. Heat pumps are not included. As noted in Appendix A, a proportional share of unclassified heating, ventilation and air condition equipment (code 100) is included here. Confined fires are excluded from the tallies of the remaining categories of fires involving equipment.Electrical distribution and lighting equipment (codes 200-299) include: fixed wiring; transformers; associated overcurrent or disconnect equipment such as fuses or circuit breakers; meters; meter boxes; power switch gear; switches, receptacles and outlets; light fixtures, lamps, bulbs or lighting; signs; cords and plugs; generators, transformers, inverters, batteries and battery charges. Torch, burner or soldering iron (codes 331-334) includes welding torches, cutting torches, Bunsen burners, plumber furnaces, blowtorches, and soldering equipment. As noted in Appendix A, a proportional share of shop tools and industrial equipment (code 300) is included here. Clothes dryer or washer (codes 811, 813 and 814) includes clothes dryers alone, washer and dryer combinations within one frame, and washing machines for clothes. As noted in Appendix A, a proportional share of unclassified personal and household equipment (code 800) is included here. Electronic, office or entertainment equipment (codes 700-799) includes: computers and related equipment; calculators and adding machines; telephones or answering machines; copiers; fax machines; paper shredders; typewriters; postage meters; other office equipment; musical instruments; stereo systems and/or components; televisions and cable TV converter boxes,, cameras, excluding professional television studio cameras, video equipment and other electronic equipment. Older versions of NFIRS had a code for electronic equipment that included radar, X-rays, computers, telephones, and transmitter equipment. Shop tools and industrial equipment excluding torches, burners or soldering irons (codes 300-330, 335-399) includes power tools; painting equipment; compressors; atomizing equipment; pumps; wet/dry vacuums; hoists, lifts or cranes; powered jacking equipment; water or gas drilling equipment; unclassified hydraulic equipment; heat-treating equipment; incinerators, industrial furnaces, ovens or kilns; pumps; compressors; internal combustion engines; conveyors; printing presses; casting, molding; or forging equipment; heat treating equipment; tar kettles; working or shaping machines; coating machines; chemical process equipment; waste recovery equipment; power transfer equipment; power takeoff; powered valves; bearings or brakes; picking, carding or weaving machines; testing equipment; gas regulators; separate motors; non-vehicular internal combustion engines; and unclassified shop tools and industrial equipment. . As noted in Appendix A, a proportional share of shop tools and industrial equipment (code 300) is included here.
Medical equipment (codes 410-419) includes: dental, medical or other powered bed, chair or wheelchair; dental equipment; dialysis equipment; medical monitoring and imaging equipment; oxygen administration equipment; radiological equipment; medical sterilizers, therapeutic equipment and unclassified medical equipment. As noted in Appendix A, a proportional share of commercial and medical equipment (code 400) is included here. Exposures are fires that are caused by the spread of or from another fire. These were identified by factor contributing to ignition code 71. This code is automatically applied when the exposure number is greater than zero.
Source: https://www.nfpa.org/
Registered
4
Average
daily search
70%
Effective
search
239
Registered
companies
You are using BETA version.
Send feedback